On March 20th 2023 the International Panel for Climate Change published the synthesis report for their sixth assessment of climate change (AR6). This is a summary of the last decade of climate research and the action we as humans have taken on climate change. It is a vitally important document.
The report is, however, 85 pages of dense science and policy information and few people have the time or energy to wade through it.
That’s where this article comes in. This is part one of a three part series simplifying the IPCC’s summary into more easily accessible reading. It covers the first part of the IPCC summary: Current Status and Trends which is concerned with where we are right now in actual global warming, its effects on the environment and human populations and our ongoing attempts at preventing more change and adapting to what has already happened.
There are five key takeaways from this part of the report, so let’s get into them.
1. Global warming is human caused
The rapid rise in global average surface temperature over the last century is a known fact by now. As is, in truth, the fact that the majority of this warming has been caused by human activity. The IPCC, like all scientists, aren’t likely to state something as fact however, if they can avoid it, and only state this is ‘virtually certain’ – their highest confidence and representing a consensus of >95% of all scientific literature.
The latest report states that global average surface temperature has risen to 1.1˚C above the long-term average (1850-1900) during the period of 2011-2020. They further clarified there has been more warming over land (up to 1.59˚C) compared to over the ocean (0.88˚C), which is what climate scientists expected to happen. This warming has taken place at a faster rate in the last 50 years than any other 50 year period for at least 2000 years. This is a big problem, because the rate of temperature rise is as important as how much the temperature is rising by.
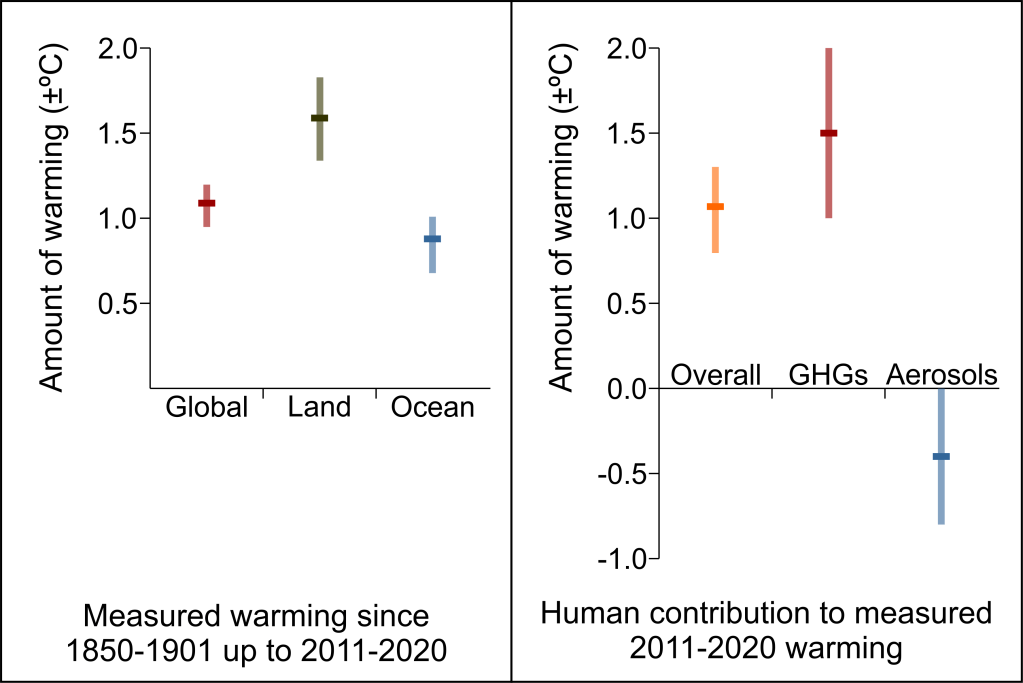
As far as the causes of warming go, the vast majority has been caused by CO2 and methane emissions. Emissions have not been spread evenly across the globe or even among different sectors of industry.
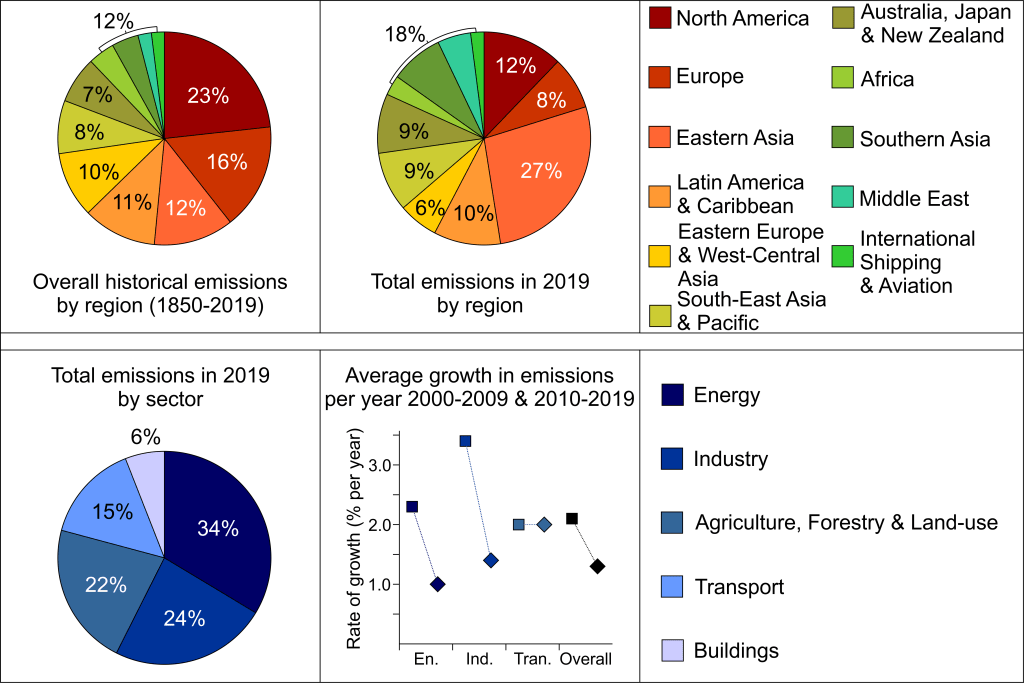
Historically speaking, North America and Europe have still contributed the most emissions overall, however, East Asia has taken over North America as the biggest contributor in recent years. In industry, the energy sector is still the worst contributor to emissions, followed closely by production and other physical industries, then land-use and agriculture, transport and construction.
It isn’t all bad news, however. The rate of growth of emissions has decreased over the last decade. Emissions are still growing, but more slowly. The strategies we’ve put in place to limit emissions are starting to have at least a minor effect. The energy and industry sectors have seen the most drastic slowing of emission growth, but we’ll come to that shortly.
The message is clear. Although emissions vary wildly across the globe and by sector, the majority of people on this planet live in countries or make use of industries that are among the highest contributors to emissions. We’ve taken a very clear step in the right direction by slowing the growth of emissions, but it is only the first small step.
2. We can see our climate changing
Global warming is what humans are doing to the atmosphere. Climate change is the effect of global warming on our natural world and our day-to-day lives.
The IPCC state that the changes to our climate as a result of global warming are now clearly observable. We have the data and we can point directly to the causes of the change. There is more than 90% confidence that humans are affecting: oceanic warming, ice loss and glacier retreat, decreases in sea ice, decreased snow cover in the Northern Hemisphere, acidification of the surface ocean and sea level rise. Less certain are the changes in precipitation and humidity, among other things, but the IPCC still assigned a ‘very likely’ probability to these changes being caused by humans. By their standards that means more than 66% certainty.
Of particular note, the IPCC looks at sea level rise and increased occurrence of extreme weather events as these things are already affecting human livelihoods worldwide.
Sea levels rose somewhere between 0.15 and 0.25 metres between 1901 and 2018. This doesn’t seem like a lot, but it has already heavily impacted small island nations. At the same time, how fast sea levels are rising almost doubled between 2006 and 2018 compared to 1971 to 2006. If the rate of sea level rise continues to increase this dramatically, we’ll see even worse consequences.
Set against this, the IPCC reports that many extreme weather events are occurring more frequently and with greater intensity. They happen more often and they are worse when they do happen. This includes: heatwaves, heavy precipitation (rainfall, snow, sleet etc), droughts and major tropical cyclones (category three hurricanes and above).
Not only that, but it appears that compound events are becoming more common as well. This is when, for example, you have an ongoing drought and a heatwave occurs at the same time. Or a wildfire is sparked in a drought-ridden area. This drastically increases the damage these extreme events cause and often overwhelms our resources when trying to deal with them.
The impact these changes to the climate have on people brings us to the next point.
3. Everyone is being affected by climate change
Even in today’s technological society, we are incredibly dependant on the natural environment around us. As a start, all our food is grown, one way or another, using natural systems. As the climate changes, it heavily impacts the environment around us and the humans who depend on it.
The IPCC notes that there has already been substantial damage to natural environments across the globe and that the impacts seen so far have exceeded the predictions made in previous reports. We have seen, over the last ten years: irreversible permafrost thaw and glacier retreat; desertification and land degradation, especially in low lying coastal areas; the loss of 50% of coastal wetlands; and mass death events where hundreds of animals die in a few days.
While, overall, we’ve increased how much food we produce through farming, the growth has been limited compared to what was predicted. This is because many of the regions around the tropics are seeing the amount of food produced drop. These are areas that have been major food producers, but land degradation and decreased water availability means they can’t grow as much.
The major effects of climate change have so far been on farming, but that doesn’t mean we aren’t seeing problems in cities. Cities and other built up areas magnify heat, making heatwaves worse. Cities and built up areas also tend to produce more air pollution and tall buildings trap that air pollution. Higher temperatures make this even worse. A lot of infrastructure, especially in countries like the UK and Canada, isn’t built to handle the heat and heatwaves have caused damage to transport, sanitation and energy infrastructure.
No one who lived through 2020 and 2021 needs to be told that diseases, especially viral ones, becoming more transmittable are a big problem. The IPCC states with ‘high confidence’ (that’s over 90% certainty) that vector diseases (i.e. viruses among others) have both increased in range (how far they spread) and reproduction (how fast they spread) because the world is getting warmer.
In truth, everyone is being affected by climate change. The IPCC does note, however, that some people are more vulnerable than others. They assess the vulnerability of populations based on poverty and inequality, governance challenges, reliance on certain industries e.g. small farmers, fishing communities and marginalisation from things like gender, ethnicity etc.
An estimated 3.3 to 3.6 billion people live in areas of high vulnerability and are at the greatest risk from climate change. That is almost half of the world’s total population. They can’t all just move somewhere where they will be less affected, even if these places would welcome them in.
So, what are we doing about all this?
4. Mitigation and Adaptation Policies are Working
It is clear just from the slowing of emissions that our attempts to slow global warming and limit climate change are starting to work. The IPCC calculated that an estimated 5.9 Gt CO2-eq per year (giga-tonnes of carbon dioxide equivalent per year) of emissions were avoided in 2016 due to the policies implemented. That is a lot of emissions that were not released into our atmosphere.
The IPCC attribute two major factors to this success. Firstly, international policies such as the Kyoto Protocol and the Paris Agreement have heavily pressured local governments to not just promise but actually implement methods to reduce emissions and then to report on successes. These larger, overarching agreements have led to smaller, more focused groups coming together to resolve specific issues regarding climate change, sustainability and disaster risk.
Secondly, public awareness and activism has played a huge role in holding governments to account and pushing them to be more ambitious. Mass social movements and protests raised awareness and influenced the outcome of climate politics. Although the IPCC made it clear that media coverage had both a positive and negative effect, because of continued climate denial movements, the overall effect has been positive.
The push at a governmental level on industry to work towards or achieve net-zero emissions has led to a massive improvement in low-emission technology as well as the cost of this technology to fall. The IPCC reports that solar and wind energy, as well as lithium-ion batteries used in electric vehicles, have dropped in price by 55% (wind) to 85% (solar and batteries). In many places, energy from solar and wind is now cheaper than the fossil fuel equivalent and yes, that includes the upfront installation costs and upgrading infrastructure.
In production, most of our primary resources e.g. metals, building materials and chemicals, are trialling low-emission or zero-emission production processes. Although the IPCC reports that few are being used commercially right now and none are industry standard, the technology exists and works. In both production and energy, small-scale test pilots now need to move to larger scale projects. The IPCC even states that this will be cheaper in the long run than trying to maintain the current systems.
As well as trying to mitigate the worst of the changes there are also signs of progress in adapting to climate change. However, the majority of money being set aside for climate policies is going into mitigation, not adaptation. The money that is spent on adapting to a changed climate varies drastically across both regions and sectors, meaning the impact of these adaptations are very limited on a global scale.
5. Mitigation Policies aren’t enough
Although a lot of the progress that has been made so far is good and should be celebrated… there is a big caveat. The IPCC has projected a number of different situations based on both the promises governments have made and what has actually been implemented. The results of those projections are clear: however much progress we’ve made so far isn’t enough.

To put is simply: the promises made at COP26 in 2021 will probably not keep global warming at 1.5˚C above the pre-industrial average. That we’re currently at 1.1˚C means we don’t really have a lot of wiggle room in this. The promises, if kept, are even going to make it difficult to keep warming below 2˚C unless they are significantly improved upon at the next stage in 2030.
That is just the promises.
The IPCC report states there is a gap between what governments have promised and what has actually been implemented. That gap is the equivalent of about 4-7 Gt CO2-eq per year and will get bigger year on year as emissions continue to rise. If this remains the same, we’re looking at warming in the region of 2.8˚C by 2100.
There are reasons why there is such a big gap between what we need to do, what we’ve promised to do and what we are doing. The IPCC focuses mostly on implementation issues, both social and economic barriers and structural factors, and points to lower-income developing countries as those that struggle most to implement low-emission targets. Lack of money and poor political incentives are the two biggest continuing limitations in both mitigating further climate change and adapting to the changes that have already taken place.
It’s important to remember that the IPCC projections aren’t hard, factual predictions, but possibilities made mostly from statistics. However, while the amount of emissions we can allow but still keep to 1.5-2˚C warming is a range, the message is still clear. If we want to keep warming below 1.5˚C we need to cut emissions by about 40-50% by 2030. That’s just seven years. That is a big ask given the small progress we’ve made so far.
A more realistic scenario, where we mostly keep to the promises we made and get more ambitious after 2030, predicts we will overshoot a little to around 2˚C of warming, but potentially be able to decrease the warming back down to 1.5˚C by 2100. Even then, however, the ambitions after 2030 have to be almost as drastic, halving emissions between 2030 and 2050.
Either way, we’re going to have to halve the total emissions eventually. It’s a question of how soon can we do it.
The takeaway
There’s a lot to be positive about when it comes to where we are right now. We have proven over the last ten years that we have the technology, finance, political and social will to do this. Governments and industry are reacting to the pressure that comes from the public and starting to act. Technology has taken time to develop and become economically viable, but it is there now. Low-emission or even zero-emission technology exists and it is efficient and cost effective.
Yet, the truth remains that for all the positivity there’s still a long way to go. We have just run out of excuses to not get this done.
It might not be comfortable, especially for poorer countries and communities, but those communities are already the ones most at risk. If we use discomfort as an excuse the costs of climate change on both the economy and on human society are going to skyrocket. Billions of people will suffer, or be forced into mass migration to save their families.
The IPCC report still has more to offer, so look out for the second part of the IPCC Summary Simplified: “Long-term Climate and Development Futures”.

Leave a reply to The IPCC Summary Simplified, Part 2: Long-Term Climate and Development Futures – Rivers of Ice Cancel reply