If you go in search of the causes of modern-day global warming and climate change you are likely to find a great deal about emissions and carbon dioxide. These are, as climate scientists have stated time and again, the main causes of the ecological disaster awaiting us. However, digging below the obvious you might be surprised to find plenty of alternate theories about the causes.
One of the most popular alternate theories is the solar cycle and sunspots. It is argued that increased solar activity produces more light than average and that is causing the world to heat up. But how true is this? Where does the theory come from and what does it actually mean for climate change?
To start with, we know the solar cycle does exist. It is described simply as how much light the sun produces at any given time. The surface of the sun isn’t a static, flat surface. Some areas are cooler than others, creating darker sunspots. Solar flares and coronal flares disrupt the surface and release radiation and light into space. How much activity there is on the surface of the sun directly impacts how much light is emitted. More activity means more light. Less activity means less light.
We also know that the amount of light that reaches the Earth can impact the climate, it’s why we have seasons. It would seem then, that solar activity and the solar cycle may have something to do with climate change. Unfortunately, it is not that simple. To explain, we need to take a look at what the solar cycle is and how we measure it.
The Sun’s Magnetic Field
It shouldn’t be a surprise that scientists have been studying the sun for as long as they have been studying the stars. Although sunspots had been observed before, it was the invention of telescopes that allowed for them to be identified as sunspots. Since then, it was possible for the number of sunspots each year to be recorded. This began in the early 1600’s, creating a relatively consistent set of data on sunspot activity for the last 400 years. With the invention of satellites this data set has improved immensely.
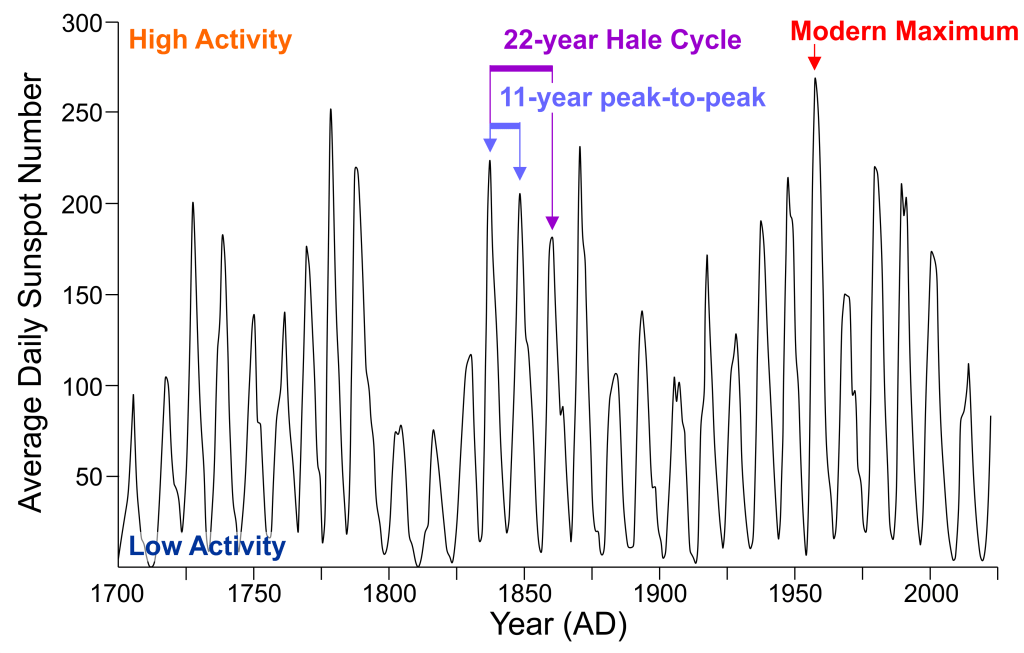
Most of this record is even available online. The Solar Influences Data Analysis Centre, based at the Royal Observatory of Belgium has the full record of average yearly sunspot numbers going back as far as 1700 AD available for download. Looking at it, we can see that there is a very clear cycle going from high numbers of sunspots to low and back to high again. This cycle going from high activity to low back to high takes about 11 years.
The causes behind this are related to the sun’s magnetic field.
The Earth has a magnetic field, that is what makes compasses work and why the north and south poles are called that. It’s formed by the dense, iron-rich core of the planet. This magnetic field plus our atmosphere protects us from a lot of radiation from space, among other things. In a similar way, the sun, too, has a magnetic field created by the nuclear reactions going on at its core.
This magnetic field, however, is less stable than Earth’s and varies a lot more. As it varies in strength and in position, it affects the activity on the surface of the sun, the sunspots and solar flares. Both the number and how big those sunspots and solar flares are, depend on the sun’s magnetic field.
From a low point of solar activity there will be a steady increase. Each year there will be more sun spots and solar flares than the previous year. Eventually this activity reaches a peak at which point the magnetic poles of the sun switch places. The north pole becomes the south pole and the south pole becomes the north pole.
After this switch, activity on the surface of the sun starts to decrease again, reaching a low point of solar activity about 11 years after it first began to rise. The same thing then happens again. There is a gradual increase in sunspot activity until it reaches a peak and then the magnetic poles switch again, back to their original positions. The south pole once again becomes the north pole. The north pole goes back to being the south pole. Activity starts to decrease and sunspots and solar flares reach a low point again.
The full cycle, in which the poles switch once and then switch back again, takes about 22 years. It is called the Hale Cycle.
Using Isotopes to Measure Solar Activity
Something else we can see from the sunspot record is that the cycles of solar activity are not always the same. Some cycles have more solar activity than others even during the lowest points of the cycle. However, the record isn’t really long enough to see if there are any other patterns explaining why some cycles are stronger than others. We certainly can’t guess why just from the sunspot record.
In order to look further back in time, we need some other way of measuring solar activity. While there are a couple of ways to do this, the most consistent option is to use radioactive decay.
Everything, be it liquid or gas or solid, is made up of combinations of different atoms. The different atoms are called elements. Basic chemistry combines atoms of different elements into molecules, which then make up everything like rocks, air and even the cells of living things. However, the tricky part is that some elements come in different forms called isotopes.
As an example, carbon, the most crucial element for living things, comes in three major forms or isotopes. Carbon-12 is the most common type of carbon, making up 99% of all carbon in the universe. Its atomic weight is 12 and this form of carbon is stable. Carbon-13, which has an atomic weight of 13, makes up just under 1% of carbon and is also stable.
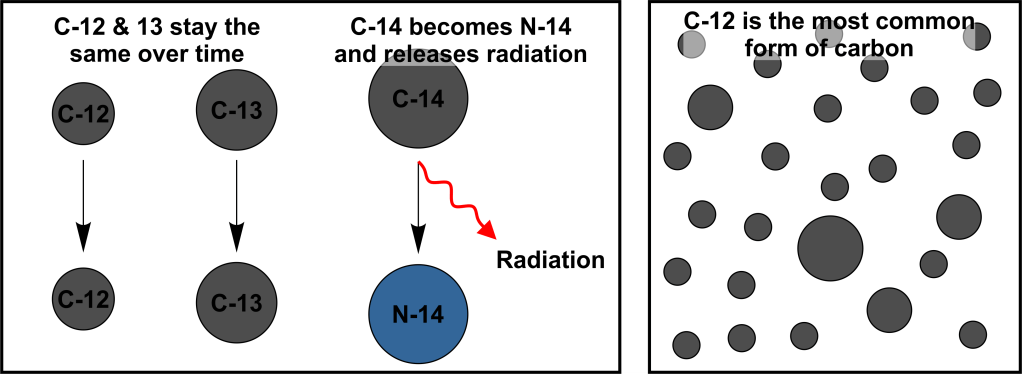
However, the third isotope, carbon-14, which of course has an atomic weight of 14, is unstable. It exists naturally in very small amounts (about 1 in every trillion atoms of carbon) as it is formed by cosmic rays interacting with Earth’s atmosphere, but once it stops interacting with the atmosphere it starts to break apart creating nitrogen and radiation.
Carbon isn’t the only element that has several forms and many elements have unstable isotopes which break down into other elements over time, releasing radiation at the same time. How long it takes for an unstable form of an element to break down is called its radioactive half-life. This is something that is always happening. However, the naturally existing isotopes are also always being formed and the difference between how much is being formed and how much is decaying over time can tell us something about the situation when it was being formed.
Additionally, if anything stops the formation of those isotopes, the overall amount of the isotope will decrease at a predictable rate. If scientists know the rate of decay and how much is there now, they can get a pretty accurate measurement of how much there was for any given date.
Carbon and Beryllium
There are two major radioactive isotopes that are used to look at solar activity. One, we have already discussed, is carbon-14 [C-14]. It is formed by cosmic rays in the atmosphere, which have been proven to correspond to solar activity (Usoskin, 2023). Higher solar activity means less cosmic rays which means less production of C-14 in the atmosphere. The carbon is then taken up by trees as carbon dioxide, where it is no longer exposed to the cosmic rays and no more C-14 is produced. The C-14 in the tree continues to break down over time and scientists can take samples of the wood to measure the amount of C-14 present.
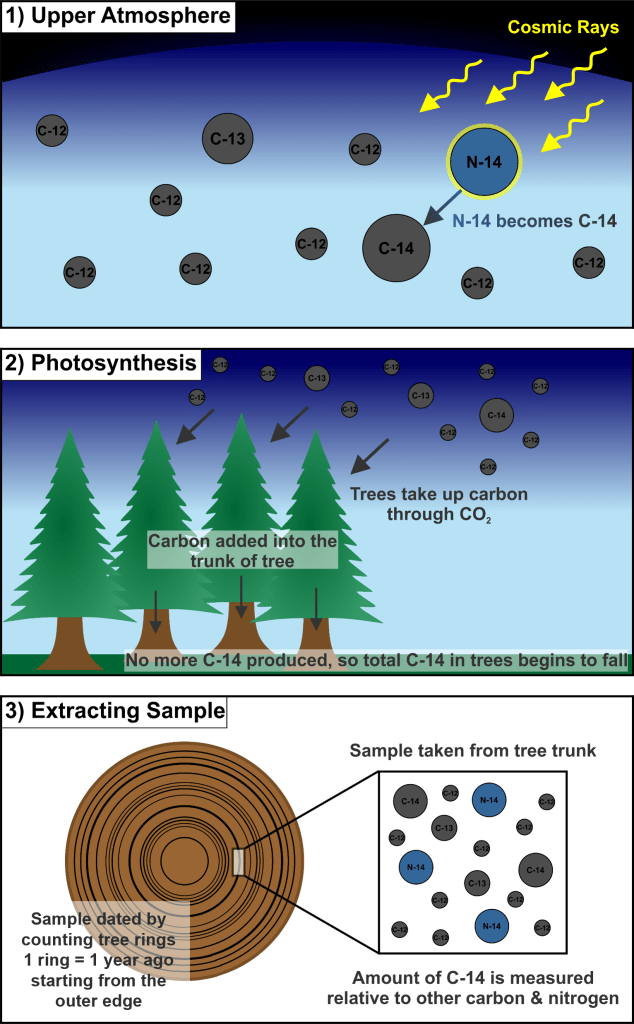
Scientists know the half-life of C-14, they know how much C-14 is in the tree sample and tree rings allow for that sample to be dated to the exact year the tree took up the C-14. Thus, we get a very good measure of how much C-14 was being produced at that time and the solar activity.
The other isotope most commonly used is Berylium-10 [Be-10] and works on a very similar principal. It is also formed in the upper atmosphere by cosmic rays. Thus, during periods of high solar activity, less Be-10 is produced.
Be-10 is generally found within ice cores from Greenland and Antarctica. Rain and snow remove the Be-10 from the atmosphere. The snow that falls on the ice at the poles becomes included into the ice sheet and preserved. The Be-10 in the ice slowly decays over time. Scientists that drill a core out of the ice can then sample it to measure the Be-10. Ice cores typically have layers that, similar to tree rings, correspond to a year’s worth of snowfall turned to ice.
Using records of the two radioisotopes we can now produce a chart of solar activity for the last 11,000 years or so. Although there are a number of charts which use slightly different ways to process the data, the best recommended I was able to find was produced by Wu et al in 2018 and covers the last 9,000 years.
Solar Minimums and Maximums
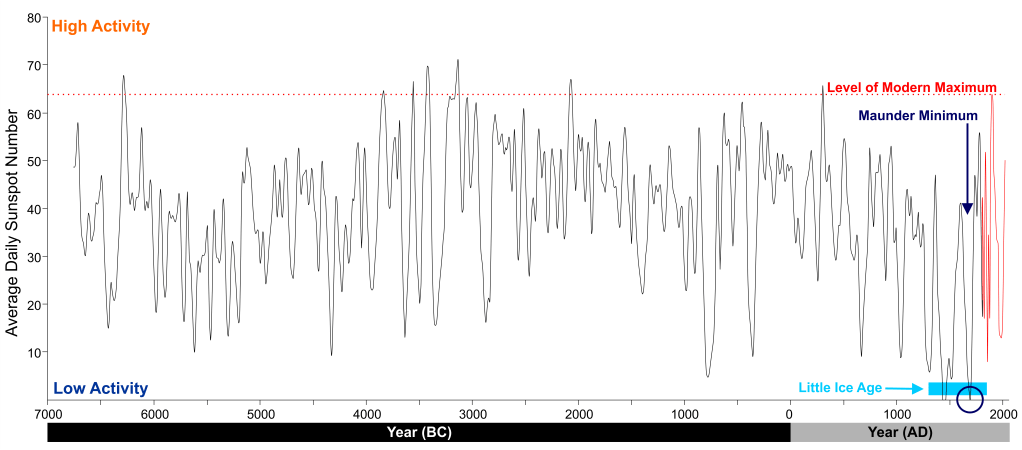
Looking at the 9000-year record by Wu et al shows that there is a lot of variation in the strength of the solar cycle over time. Some periods exist where there is very little solar activity at all e.g. around 1600 AD and some periods where there is more solar activity than the average cycle e.g. around 3000 BC. Wu et al (2018) don’t try and explain this, as they were concerned primarily with producing the record rather than decoding it.
A review of all the recent studies of sunspots by Ilya Usoskin in 2023 discussed the possibility of a number of additional, longer-time scale cycles that may impact the strength of the solar cycle. However, while the studies identified a number of possible cycles on a variety of scales, Usoskin suggested that there wasn’t yet enough conclusive evidence for any beyond the 22-year Hale cycle.
What Usoskin (2023) did discuss however, were the periods that were either of lower overall activity and the periods of higher activity, called solar minimums and solar maximums. This is of interest because the record from the last 400 years contains both of these things, which was considered important to climate science at one stage.
The ‘Maunder Minimum’ which took place in the late 1600’s saw very little solar activity even at the peak of the Hale Cycle corresponding to what is known as the ‘Little Ice Age’. Similarly, there was a rise in the maximum amount of solar activity into the 1940’s and 50’s, leading to much higher-than-average solar activity. For a time, this was seen as a reason for modern day warming. If periods of low solar activity can cause a ‘little ice age’, then surely periods of high solar activity can cause a warm period?
Modern analysis however has thoroughly debunked both of these facts.
The Little Ice Age is known to have begun as early as 1300 and lasted until 1850. It did, in fact, see two periods of solar minimums, from 1450-1550 and 1645-1715. While both may have caused additional cooling of the climate during the Little Ice Age, neither was the cause of the Little Ice Age, which has been attributed to changes in atmospheric circulation and an increased number of volcanic eruptions.
Similarly, although solar activity was increasing to a maximum in the 1940’s and 50’s, since that peak the solar activity has been decreasing back to the long-term average. The last Hale Cycle ended in 2019 and was, in fact, comparatively weak. Looking at the 9000-year record, there were many times in the last 9,000 years where solar activity was above the 1940-1950 peak. It is simply impossible for solar activity to realistically be the cause of modern-day global warming.
The Truth About Sunspots
As part of the ongoing attempt to undermine climate science, it has been suggested that modern day global warming can be attributed to the cycle of solar activity, particularly sunspots. More solar activity and more sunspots mean more light is produced. This light causes increased warming.
However, scientists have been able to piece together a record of sunspot numbers and thus solar activity for the last 9,000 years. A brief look at this record can show, quite clearly, that there is nothing particularly notable about the most recent cycles of solar activity. Although there was a peak in solar activity in the 1940’s and 50’s, this has not continued through to the 21st century, while global warming has continued unabated and at exceptional rates.

Leave a comment