The ice sheets over Antarctica and Greenland are going to collapse, we have been told by scientists. As the world warms, the ice will melt away and the fresh meltwater will flow into the ocean, raising sea levels. However, despite the dramatic language, what does it actually mean for an ice sheet to collapse? Does all the ice just disappear all at once? Or will it disappear in patches? How long will it take?
More, importantly, how do we know? It’s not like we’ve seen an ice sheet collapse in our history. Are we not just guessing based on the fact that we know ice melts?
There are two sides to studying ice sheet retreat and collapse. There are the modellers, who will build computer reconstructions of ice sheets and put them through various amounts of warming and see what happens. Then there are those who study the history of ice sheet retreat. Yes, it’s true that humans as a species haven’t seen an ice sheet collapse, but that doesn’t mean it hasn’t happened before.
Those who study past ice sheets will generally pass their analysis and conclusions onto the modellers, to create better and more useful models so we have an idea of what might happen if and when the Antarctic and Greenland ice sheets collapse.
The Last Glacial Maximum
There have been many ice sheets in the millions of years of Earth’s history. The most useful ones from the perspective of modern global warming and climate change are those from what is known as the Last Glacial Maximum, or LGM.
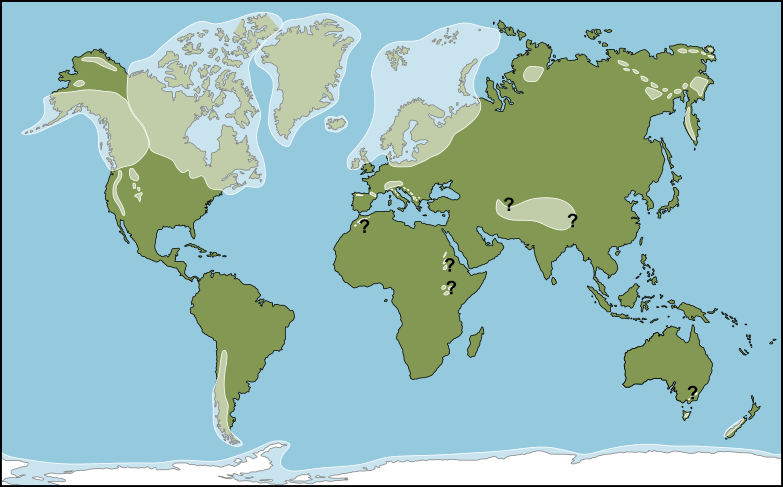
The Last Glacial Maximum is just as the name describes. The last time that glaciers and ice sheets were at their maximum extent, before global-wide glacial retreat and collapse. This happened between 26,000 and 20,000 years ago. During this time mountains across the globe, from the southern Andes in Chile and Argentina to the Himalayas and the European Alps, were covered by large ice caps with ice extending far down their slopes and into lowland areas. A large portion of northern Europe including the British Isles, Scandinavia, Denmark, northern Poland, Estonia, Latvia, Lithuania and north-west Russia were all completely covered by an ice sheet over 2 km thick. North America was in a similar position with Canada entirely covered by an ice sheet up to 3km thick. The north-eastern United States saw ice reaching almost as far south as Manhattan Island.
We know this because ice sheets leave behind a lot of evidence for their existence in the landscape and soil. Ice sheets can be considered to act like a bulldozer through the landscape. They carve their way into the land, pushing lots of soil and rocks along in front of them and then, when the ice starts to melt and retreat back, all that material is just dumped and left. Sometimes up to a hundred kilometres from where it started.
This dumped material will generally create a long, thin mound in the landscape that, when seen from above, forms an arc. We call this terminal moraine. ‘Terminal’ because it forms at the furthest extent of a glacier – at its terminal or end point. ‘Moraine’ is simply a descriptor for a landform that is left behind by an ice sheet or glacier retreating. Usually, moraines are made up of a thick clay-rich soil with chunks of rock embedded within it. The arc of a terminal moraine will tell us which way a glacier or ice sheet was flowing. Ice travels slower at the edges of an ice sheet than in the centre, so the centre will always be a little bit ahead of the sides.
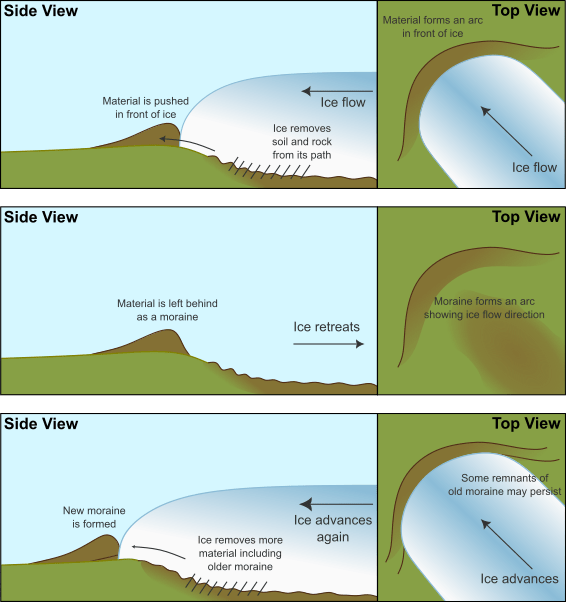
Terminal moraines are very useful for tracking how an ice sheet has retreated simply because they represent either the furthest extent of the ice sheet, or a place where the ice sheet has paused for a long time. However, because they are made of a very soft material, they are very easy to destroy. If the ice sheet starts to grow again and moves over where the terminal moraine was left, it will bulldoze the terminal moraine just like everything else.
Knowing this, if you see a set of terminal moraines in the landscape, lying next to one another like a set of ribs, we can predict that this is showing the persistent retreat of an ice sheet. The ice sheet started at the moraine that is at the furthest extent and retreated back and back again, pausing and creating new terminal moraines, but never growing. If it had grown, the terminal moraines it had previously lain down would have been destroyed.
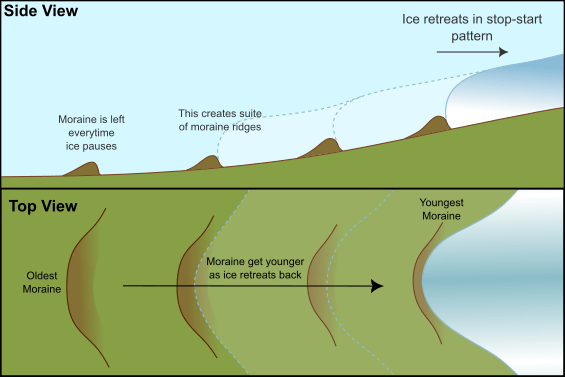
If a scientist can then date the terminal moraines, they not only know how the ice sheet retreated, but also how fast. The difference in ages of any two moraines that sit beside one another and the measured distance between them can be used to calculate how much ice retreated over a given time.
Dating how long rocks have been exposed
Dating a moraine isn’t a simple task. Mainly because many of the dating techniques that are typically used simply aren’t an option. There usually isn’t any carbon we can date, there aren’t clear layers like in tree rings or lake beds which represent a year of growth for each layer. So how can scientists date it? Well, they use cosmogenic isotopes.
We’ve discussed cosmogenic isotopes before (Is there really a connection between sunspots and global warming? Science has the answer). They are isotopes of common elements (that is, the atom is of the same element but has a different weight) that are formed when hit by cosmic rays. This usually happens in the upper atmosphere because cosmic rays are quite weak and can’t really penetrate any kind of solid or even most liquids. However, they can be formed when cosmic rays hit the surface of a rock so that the very outer layer of a rock will build up these isotopes during the time it is exposed to the open air and sunlight.
The most common isotope used in this way for glacial landscapes is Berilium-10 (Be-10), though there are others that are used depending on how long ago the rock was exposed to the open air.

The way it works is that a rock is picked up out of the ground, where it was buried, by the ice sheet. The ice sheet then transports the rock away from where it was originally buried, mixing it up with all the other rocks and clay it has removed from the landscape. When the ice then starts to retreat the rock becomes part of the terminal moraine, with at least one surface of the rock exposed on the top of the moraine. This exposed surface is hit by cosmic rays and starts to build up Be-10. As the rock was buried before, it didn’t have any Be-10 to start with. Thus, a scientist can take a sample of the rock, measure the Be-10 within it and then, based on how fast Be-10 is made, can work out how long ago the rock was exposed to the air.
That then gives us a close approximation of how old the terminal moraine is.
The sampling method is very important when using this form of dating, because you need to be certain that the rock you are sampling has not previously been exposed, otherwise the dates you get will be too old. Fortunately, ice is very good at wearing rocks down and because the cosmogenic isotopes are only found very close to the surface of the rock, it isn’t hard to find rocks that have not been exposed previously.
Ice Sheet Collapse is Complicated
So, we know how to identify patterns of ice sheet retreat and we have methods to date this retreat and understand how fast it happened. We, presumably, therefore have a good idea of how the ice retreated after the Last Glacial Maximum and what that means for modern day ice sheets, right?
What our studies of the retreat after the LGM have told us, is that the retreat of ice sheets is complicated and does not happen all at once. The parts of the ice sheet which retreat the earliest and the fastest are the ones that are most vulnerable to temperature changes. This can be ice that is thinner than the rest. It could also be ice that is prone to travelling much faster than the ice sheet around it. Or, it could be ice that does not have a stable bed to slow down the rate of retreat.
It also tells us that retreat is not continuous. Ice can retreat a little, then grow to cover a larger area, before retreating further. This is because the retreat of an ice sheet is a balance between how fast it is melting and how fast it is moving downhill. Sometimes ice will get ‘stuck’ in one place for a long time, usually because there is some kind of blockage in the way, and this means the ice slows down. As the ice melts away from the blockage, there is nothing slowing it down anymore. The ice speeds up very quickly and appears to start growing again. However, the ice is still melting so even though it is moving faster and covering a larger area it is getting thinner at the same time. A thin ice sheet will melt faster.
Although there is no clear boundary between what is defined as ice sheet retreat and ice sheet collapse, it is widely considered that ice sheet retreat is generally a slower and more stable process. It will happen in pulses of retreat and growth and retreat again over thousands of years. Often there will be long ‘stand-stills’ where the ice is neither growing nor retreating, which will form a cluster of terminal moraines tracking back from the lowland regions to the mountains.
Ice sheet collapse is faster. We don’t know exactly how fast it could be, because exposure dating typically returns dates within a few hundred years. It is likely to be many times faster than the usual retreat. Often ice sheet collapse is seen alongside evidence of very fast ice flow, because faster flowing ice is usually less stable. Fewer terminal moraines are left in the landscape and are much more widely spread apart, because there are fewer ‘stand-stills’. The ice is melting away too quickly for moraines to form. There may not even be any terminal moraines at all, because bursts of unsustainable growth override any deposits that had previously been left.
However, ice sheet collapse does not typically mean the entire sheet will collapse at once. Ice sheet collapse will generally happen in the outer edges of an ice sheet, or in particularly vulnerable valleys, while the mountains where the ice sheet is more stable will only see a steadier retreat. This means that an ice sheet can collapse multiple times during its retreat, releasing vast amount of meltwater in a short space of time, before returning to a much slower retreat.
The collapse of an ice sheet is not just fast – it happens in pulses that are almost impossible to predict. If we can’t predict it, we can’t prepare for it.
West Antarctica is likely to collapse
The ice sheet over West Antarctica is considered the most vulnerable of the three major ice sheets currently on Earth. This is because scientists believe it is prone to collapsing rather than retreating. West Antarctica is generally thinner than East Antarctica, and lies over land that is inherently unstable. There’s more information on why West Antarctica’s base is unstable in our article ‘Why the disappearance of ice from West Antarctica is a big problem for our future‘. However, the simplest explanation is that, if the ice sheet was not present, West Antarctica would be a shallow sea. As the ice sheet retreats, water will flow into that shallow sea and ice that is in contact with water is always going to melt faster than ice which is not in contact with water.
Scientists are still looking for evidence of whether the ice sheet over West Antarctica has collapsed before and, if it did, to what extent and what impact that had on sea level. They are using a combination of methods to investigate. This includes drilling sediment cores to find evidence for a sudden, large input of freshwater. It also includes looking at maps of the sea bed to see the extent of ice during the Last Glacial Maximum and how fast it retreated. Finally, it includes using geophysical techniques to look at the layers of rock underneath the sea bed to find buried features like terminal moraines, to see if we can identify a potential collapse in that way.
Although we don’t have definitive evidence that we can use to inform models of modern West Antarctic retreat, we do have a fairly good idea of which parts of West Antarctica are the most likely to collapse. We also know that if and when the collapse comes, it will be fast, perhaps over the course of a decade, and it is unlikely to all happen at once.
References for LGM Map
European LGM Extent: Hughes et al., 2022 ‘The European Glacial Lanscapes from the Last Glacial Maximum – Synthesis’ Chapter 64 of European Glacial Landscapes, Maximum extent of glaciations, Elsevier
North American LGM Extent: Levsen & Mort, 2009 ‘Inter-simple sequence repeat and morphological variation in the western North American range of Chrysosplenium tetrandrum’ Canadian Science Publisihing, Botany
East Coast US LGM Extent: Tulenko et al., 2020 ‘Delayed and rapid deglaciation of alpine valleys in the Sawath Range, southern Rocky Mountains, USA’ Geochronology
Northern Hemisphere LGM Extent: Batchelor et al., 2019, ‘The configuration of Northern Hemisphere ice sheets through the Quaternary’ Nature Communications
South American LGM Extent: Glasser et al., 2008 ‘The glacial geomorphology and Pleistocene history of South America between 38°S and 56°S’ Quaternary Science Reviews
New Zealand LGM Extent: Trewick & Bland, 2012 ‘Fire and slice. Paleogeography for biogeography at New Zealand’s North Island/South Island juncture’ Journal of the Royal Society of New Zealand
Australian LGM Extent: Barrows et al., 2002 ‘The timing of the Last Glacial Maximum in Australia’ Quaternary Science Reviews
Australian LGM Extent 2: Deckker et al., 2020 ‘Climatic evolution in the Australian region over the last 94 ka – spanning human occupancy -, and unveiling the Last Glacial Maximum’ Quaternary Science Reviews
Himalayan LGM Extent: Kuhle 2011 ‘The High Glacial (Last Ice Age and Last Glacial Maximum) Ice Cover of High and Central Asia, with a Critical Review of Some Recent OSL and TCN Dates’ Chapter 68 of Developments in Quaternary Science, Volume 15
African LGM Extent: Groos et al., 2021 ‘Nonuniform Late Pleistocene glacier fluctuations in tropical Eastern Africa’ Science Advances

Leave a comment